
It can be daunting when it comes to PPC optimisation and evaluation.
You never start from the same place and it can be easy to lose track of your optimisation history (without meticulously going through the change history).
The worst case scenario is mistakes are made and fly under the radar until the consequences of the mistake are felt.
Spending my working days immersed in the AdWords dashboard, I’ve compiled some tips below to help you avoid mistakes and ensure your campaigns are running as efficiently as possible.
Don’t forget to make notes.
You may have a lot of ideas that you want to test based on your account’s historical data, your hypothesis, or simply to test a new article that you just read on the train.
Test them, but make notes to yourself to come back and review those experiments.
#1 Rule: Do not assume until your idea is backed up by data.
So if you are not sure of what has caused certain metrics to change, then this is the time for you to re-evaluate them.
If you keep track with your own annotations and the dates you started those tests, you will be surprised by how much faster you can improve your account performance.
Don’t test everything at once
 Image credit: http://wallpaper-gallery.net/wallpapers/lab-wallpaper.htmlThis goes without saying.
We cannot simply conclude if a click rate increased due to changes in the ad headline or call-to-action if we tested both ideas on the same ad.
#2 Rule: Your tests should be mutually exclusive of each other.
So instead, you should run your idea with a similar campaign, or what it is commonly called, a control group.
Once you’ve gathered enough of a sample, check the variances between the two test groups. Compare by labels if that is easier for you. Personally, I prefer the flexible filtering option and refer to my notes.
Ensure the veracity and quality of your data
Make sure that your data is unbiased in any way.
#3 Rule: Your sample collection should be random.
For ad testing, instead of using optimize by click, the Rotate Indefinitely option is a better choice to get the true, unbiased reflection of the test result.
Be sensible.
Find the date range that gives you a good overview.
#4 Rule (last rule, I promise): The larger the data sample, the more accurate and unbiased your data will be.
When you evaluate data over a shorter timescale, your data might be prone to seasonal changes or other macro changes.
So in an ideal world, it would be best to evaluate yearly performance.
However, not all of us are privileged to have that much data to tinker, so try to give your experiment some time to adapt.
One to two months should be enough for small tests to mitigate any discrepancies in weekly changes.
Do your data visuals tell you the wrong story?
When you are presented with a bunch of raw data, it could be easier to pull out a graph that would hopefully give you a better understanding, but beware of carelessly interpreting your visuals.
For example, if you see an increase in cost per click, you would tend to assume that the increased competition is the culprit.
Remember that correlation does not mean causation.
Competition could be one of the factors out of many other underlying factors.
So ask yourself, did your experiment single-handedly increase your PPC performance, or was it caused by other reasons such as a trend?
Here’s the bonus:
Now let me show you an example of how two different visuals from the same data can tell you two entirely different stories.
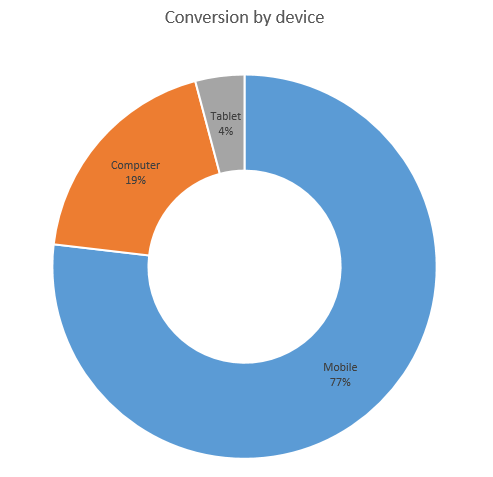
At a glance, the chart above shows that a relatively small number of conversions come from Tablet device.
On its own, you might consider excluding the tablet device and focus on high-performing devices, i.e Mobile and PC.
Now consider the graph below with the same data source:
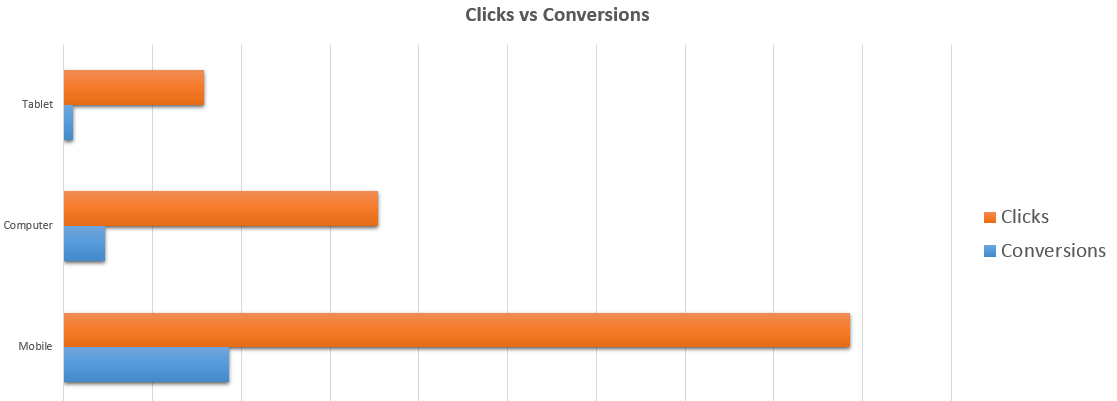
Does it give you a different reporting outlook now?
If you are used to PPC, you will immediately get a different understanding from this bar graph.
It simply tells you that the number of conversions depends on the number of clicks you get from your ad and that each device is as equally important.
In that case, you should continue to include all devices and look for other ways to improve your account.
Your spend might not even be substantially higher for Tablet than for Mobile or PC unless you have a drastically uneven CPC for each device, which is rather unlikely (from my experience in AdWords and Bing).
Summary:
- Make notes of your experiment and the date.
- Test each idea independently (baby steps).
- Make sure your data is random and substantial enough to make inferences.
- Make a template out of your optimal graph.
Be sure to find out which visuals give you the best explanation and all you have to do is pull out the data based on the timeline of your experiment, et voilà!
You should be able to review any account performance within a few clicks.
By this point, you might already save yourself from wasting countless management hours and unnecessary reporting mistakes that might sabotage your search marketing performance.
Rigorous testing and constant optimisation is key to success and I highly recommend you to do so, but do it carefully.
After all, great inventions come from experiments.
Image credit: Karthesr