In today’s digital landscape, there are endless possibilities for businesses and organisations to reach their target audience. From social media to email marketing, there are countless channels to explore. But with so many options available, it can be challenging to know where to focus your efforts.
That’s where Google Analytics comes in.
Google Analytics is an INSANELY powerful free analytics tool.
But here’s the catch: most businesses and organisations only use it to scratch the surface.
Imagine having a sports car and only using it to drive to the grocery store. That’s why we’re here to show you how to take Google Analytics from 0 to 100 real quick.
While most businesses, charities, and NFPs use Google Analytics to track their website’s performance and goals, there’s much more to explore beneath the surface.
With the launch of Google Analytics 4, you can now track user behaviour across multiple platforms and devices, giving you a more holistic view of your audience.
That’s where this guide comes in.
In this definitive guide, we’ll take you through everything you need to know about Google Analytics 4 and how to use it to improve your digital marketing game.
We’ll cover:
- What Google Analytics 4 is and how it works
- How to Use Google Analytics 4
- Google Analytics Metrics and Dimensions
- Best ways to use Google Analytics 4 reports
So, are you ready to unlock the full potential of Google Analytics?
Let’s dive in.
So, what is Google Analytics?
Well, it’s a free tracking tool created by Google to give you deep insights into how people use your website or app across different devices and platforms.
With Google Analytics, you can finally get answers to some of the most important questions about your audience, like who they are, how they behave on your site, and what content resonates with them the most. And the best part? You can use this data to improve your marketing ROI and grow your business.
Let’s say you’re running a website for a non-profit organisation that helps Australian wildlife in need. In this case, you can use Google Analytics to gain insights into your website’s traffic and understand how your audience engages with your content.
For instance, you can use Google Analytics to track the number of visitors to your site and learn about their demographics. This information can help you tailor your website’s content and messaging to appeal to your target audience and increase engagement.
Additionally, Google Analytics can help you understand how people find your website and which pages or content are resonating the most with your audience. Armed with this knowledge, you can optimise your website’s content to better communicate your organisation’s mission and encourage visitors to take action, such as making a donation or volunteering.
And because it’s built by Google, GA is designed to integrate seamlessly with other Google marketing platforms, like Google Ads and Google Search Console, as well as external tools like Salesforce Marketing Cloud. So you can take your marketing game to the next level.
In a nutshell, Google Analytics is the ultimate tool for anyone who wants to understand their audience better, improve their website’s performance, and make data-driven decisions.
GA4 vs UA: What’s New?
In October 2020, Google announced it would roll out one of the most significant updates in the history of Google Analytics: Google Analytics 4, or GA4.
According to Google, Google Analytics 4 is the “next-generation” of website analytics that’s designed to help marketers gain a complete view of the customer, derive meaningful insights, and get better ROI from marketing.
There are four key features that Google has introduced with its latest Analytics update:
Smarter insights using machine learning
Google Analytics 4 uses Google’s highly sophisticated machine learning models to alert webmasters to significant data trends, such as increasing demand for a product or service. It also has predictive metrics that anticipate future actions that customers might take, such as the likelihood of churn or lifetime customer value.
Customer-centric measurements
While previous versions of Analytics measured data in silos by device or platform, Google Analytics 4 provides marketers with a more holistic view of how customers interact with a business.
Using multiple identity spaces such as user IDs and ads personalisation, you can now follow a customer throughout their journey across all devices and platforms. This is incredibly valuable when it comes to understanding the customer journey across the entire lifecycle, from acquisition to conversion and retention.
Deeper integration with Google Ads
GA4 offers new Google Analytics integration across Google’s suite of marketing tools, including Google Ads, and the ability to measure interactions on the web and apps. This means you’ll be able to have an even more comprehensive view of conversions from YouTube videos, paid channels, organic search, social media, email marketing, conversions from YouTube video views, Google and non-Google paid channels, Google Search, social, and email.
Granular data controls
Data tracking and privacy are hot topics right now, which is why Google Analytics 4 also incorporates all-important considerations around how customer data is tracked and stored. With GA4, you’ll be able to better manage how you collect and use Analytics data, as well as when you use data to optimise ads.
“Because the technology landscape continues to evolve, the new Analytics is designed to adapt to a future with or without cookies or identifiers. It uses a flexible approach to measurement, and in the future, will include modelling to fill in the gaps where the data may be incomplete.”
Vidhya Srinivasan, Google VP/GM Buying, Analytics and Measurement
Is it worth switching to Google Analytics 4?
Unfortunately, switching to GA4 is inevitable. It just depends on if you want to start using the platform sooner or wait until later.
Google has announced that Google Analytics 4 will replace the current Universal Analytics on July 1, 2023.
If you set up your GA account now, you’ll be directed to set up a GA4 account from the get-go. If you’re currently using Universal Analytics, your account will automatically be switched over to GA4 after that date, regardless of whether you’ve opted into it or not.
Even if you don’t want to start using Google Analytics 4 straight away, it’s important to set up a GA4 property to run in parallel with your Universal Analytics.
You’ll get a head start on data collection, which will make future machine-learning insights from Google Analytics 4 more accurate. More importantly, it’ll give you time to familiarise yourself with the platform and jump straight in when it’s time to make the transition.
How to use Google Analytics 4
Thankfully, GA4 is just as easy to configure as Universal Analytics. All you need to do is connect a new GA4 data stream to your existing Google Analytics account.
Log on to your Google Analytics account, then click the “Admin” gear icon in the bottom left-hand corner.
Once you’re in here, make sure that you’ve selected the correct Account and the correct property. Then click “GA4 Setup Assistant” under your desired property.
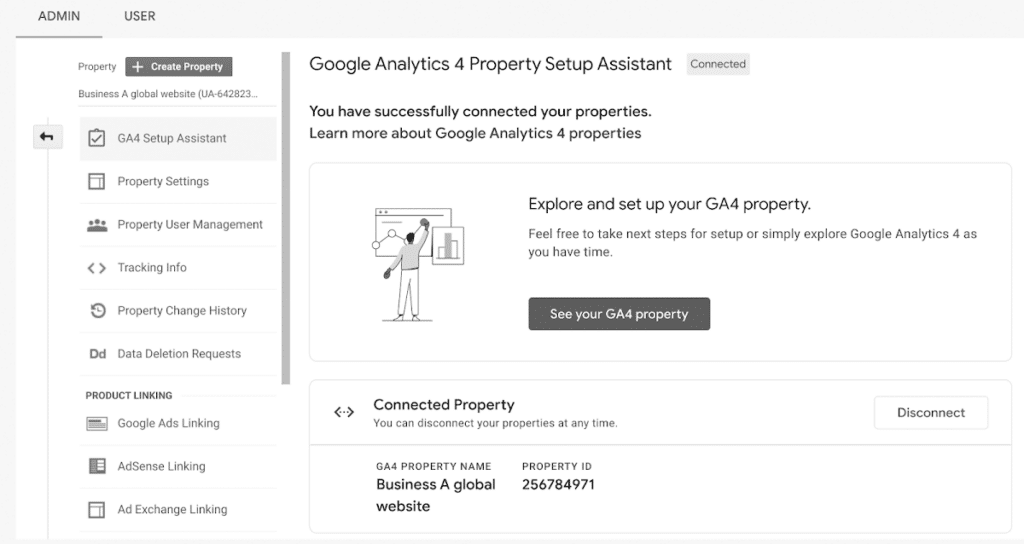
After clicking on this, you’ll find yourself in the Google Analytics 4 Property Setup Assistant. Click the “Get Started” button to set up a new Google Analytics 4 property based on your existing Universal Analytics property.
A pop-up will appear with the GA4 wizard. Simply press “Create Property”.
After this, your properties will be connected and you’ll be able to access your Google Analytics 4 property on the next page.
You’ll also be able to toggle between your GA4 property and Universal Analytics property from the top navigation bar, like so.

Google Analytics Metrics and Dimensions Explained
There are a TON of terms that are used in Google Analytics reporting.
When you’re just starting out, it’s overwhelming. But you need to familiarise yourself with the terminology available if you want to extract the most valuable insights from the platform – starting with metrics and dimensions.

Dimensions
Dimensions are categorical variables that are used to describe and organise your data. These include factors like browser, country, language, device, or customer type.
Each dimension in Google Analytics has different values depending on the dimension. For example, the Browser dimension sorts data by different browsers such as Chrome, Safari and Edge. Meanwhile, the Channels dimension sorts data by different channels, such as Social, Email or Organic Search.
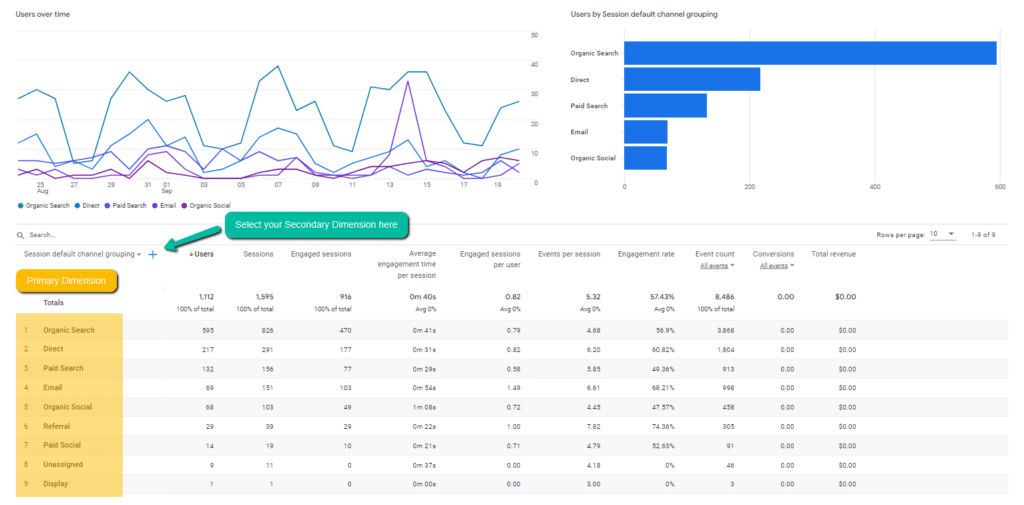
In each report, you have a Primary Dimension that offers a top-level insight based on pre-selected metrics. In the case of the Channel report above, the primary dimensions are Default Channel Grouping, Source / Medium, Source and Medium.
Then there are Secondary Dimensions. These allow you to drill down even further into the dimension by sorting your data into subcategories:
In this example, you can filter the channels down further by traffic sources to see which search engines or social platforms are driving the most traffic to your site:
Google Analytics also allows users to add their own Custom Dimensions. These are data points that the tool might not track by default, but that matter to a business, such as the total value of unpurchased cart items for eCommerce, or email subscribers for a B2B business.
Metrics
Metrics are quantitative variables that can be expressed through numbers, such as numbers, percentages, time, or dollar value. These show how a website is performing relative to a specific dimension.
By default, metrics are broken down into categories based on three stages of the customer journey: Acquisition, Behavior and Conversion.
Still with us?
Good, because there are two other components to wrap your head around before diving into Google Analytics reports: Audiences and Segments.
Audiences
Audiences are groups of users that share a common thread. This is another handy way of focusing on how different types of people behave on your website.
Google Analytics has multiple built-in audiences, including Location, Age, Gender, and New vs. Returning. You can also build your own audiences — for example, if you wanted to track how 25 to 34-year-olds in New York behaved on your website, you could create a custom audience for that demographic.
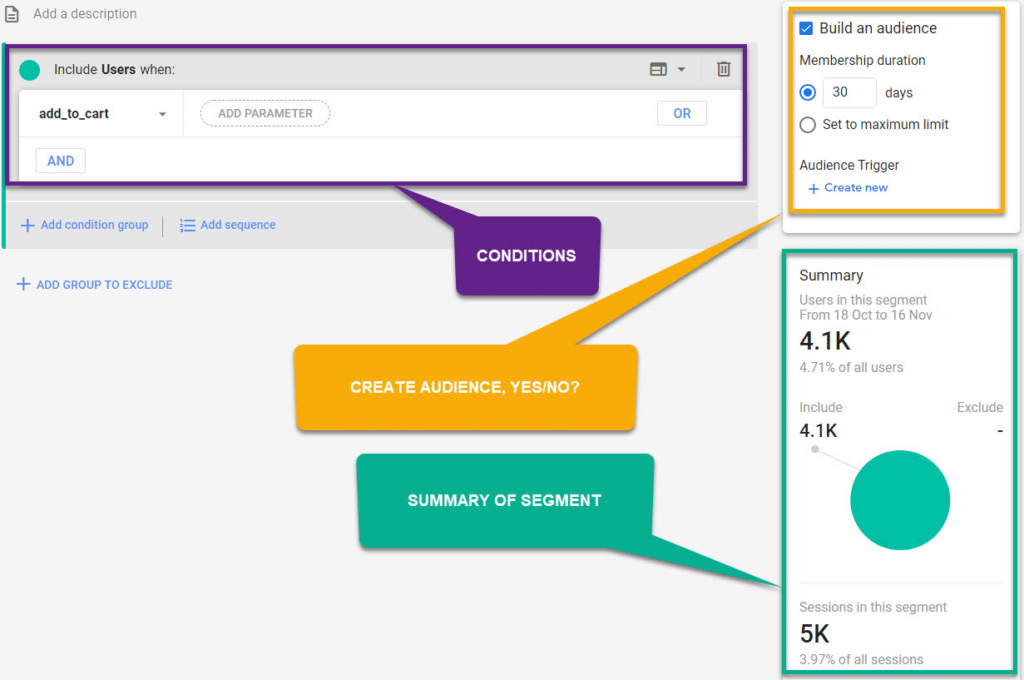
Segments
A Google Analytics segment is a subset that allows you to filter your data to focus on specific users.
Let’s say you just started running a PPC campaign, and want to see how much this is really moving the needle on your website. In this case, you could segment your traffic by Organic Search and Paid Search to see which channel is providing you with more visitors.
Likewise, you could filter your traffic by age and gender to see which audience segments are most engaged with your site:
Similar to audiences and dimensions, Google Analytics has built-in segments which you can access at the top of each report:
There’s also the option to build your own segments based on users, sessions and hits.
Best ways to use GA4 reports
Google Analytics 4 is undeniably useful for SEO. You can use the platform to see how users from different search engines behave on your website, which site content has the highest engagement, top traffic referrals, and so on.
But all of that starts with understanding how to use Google Analytics 4 reports.
As you can see from the image below, there are A LOT of different reports available in Google Analytics:
In this section, we’ll look at the best way to use GA4 reports for SEO and other reporting purposes.
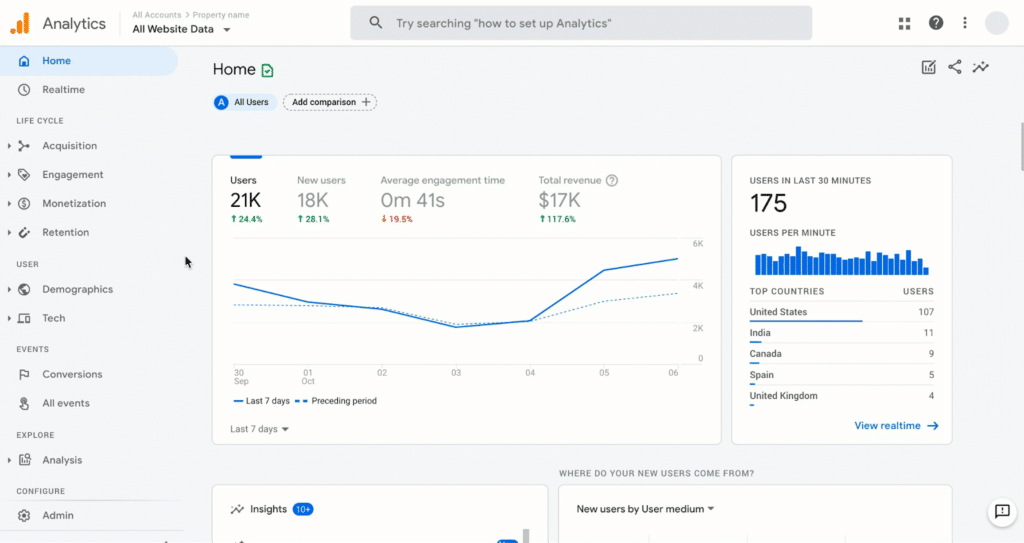
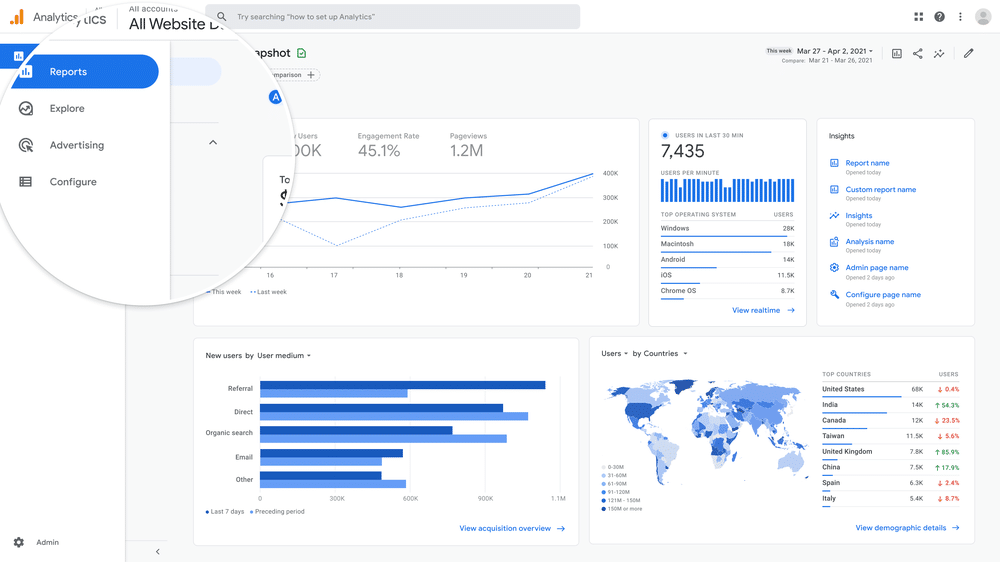
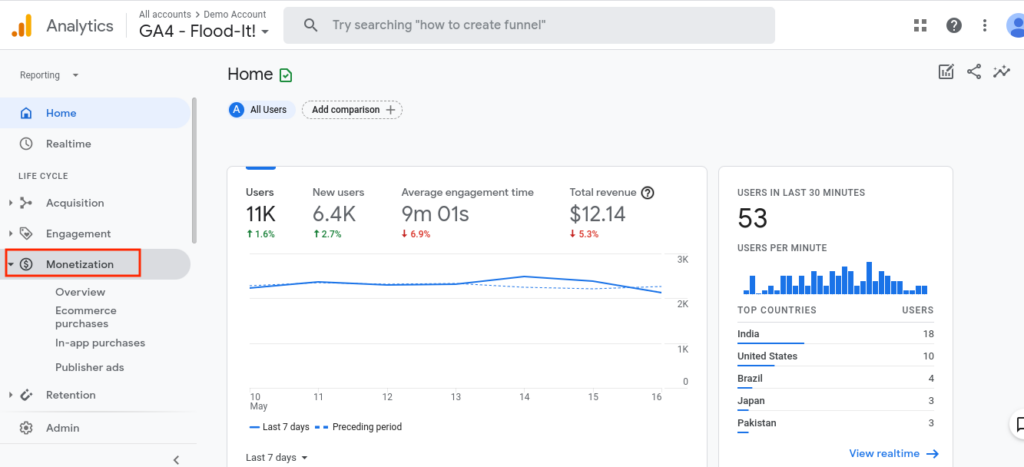
Reports snapshot
As soon as you log on to Google Analytics, you’ll get a snapshot of how your website is doing at a glance:
This is helpful if you want to quickly check in and see:
- How you’re tracking in terms of website traffic, both in terms of total users and new users
- Overall engagement levels on your website
- Where your users are coming from
- Top campaigns and landing pages
- Online store statistics, including top-selling products or revenue generated
- Recent insights based on Google’s Analytics Intelligence

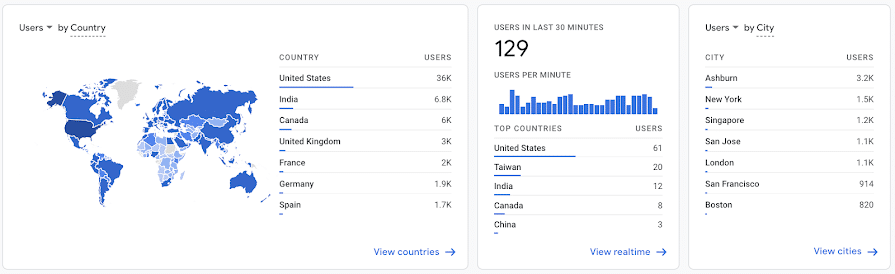
Realtime report
The Realtime report shows events that have happened on your website in the past 30 minutes. With this report, you can see a breakdown of where your visitors are located geographically, where they’ve come from, the devices they’re using, and more:
Realtime reports are particularly useful if you want to gauge the immediate impact of an event.
Let’s say you’ve just had an article published on a popular industry blog with a link back to your website. You could use real-time reports to see how many people are following that link, where they’re from, and how they’re behaving on your site — all as it happens. The same goes if you publish a social media post pointing back to your website, or a blog post that gets distributed via email and social.
In addition to the overall snapshot of your website in the past 30 minutes, Google Analytics 4 has a handy feature called View user snapshot.
You can use this to get a look at any one visitor’s interaction on your website, such as their location and the pages they navigated to as they engaged with your content.
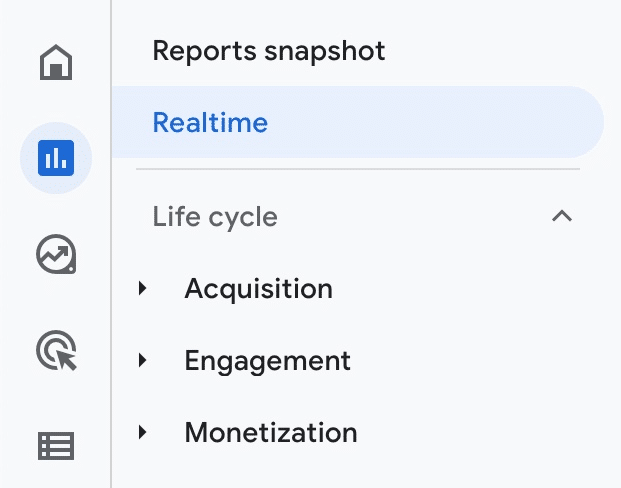
Life Cycle Reports
Life cycle reports break up key insights into the different aspects of the customer funnel:
- Acquisition: Where are your users coming from and how do they enter your funnel?
- Engagement: How do your users behave once they’re in the funnel?
- Monetization: How much revenue are you generating from your website?
- Retention: How frequently do users engage with your website after their first visit?
Let’s take a look at each one in more detail to see how to read and use these reports.
Acquisition Overview
Jump into the Acquisition section, and you’ll be greeted with an Acquisition overview like this one:
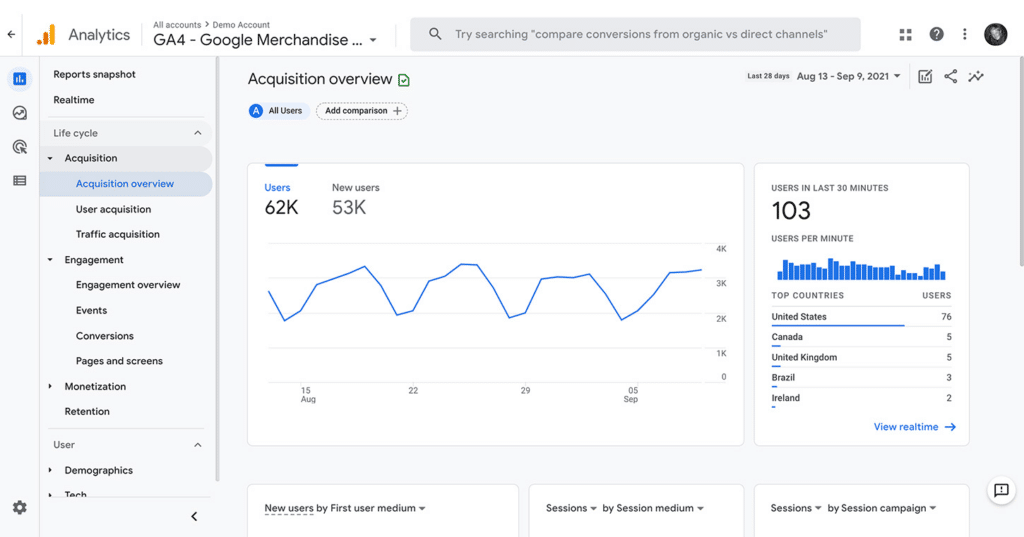
The top-level summary breaks down the key metrics relating to user acquisition. In the top left-hand corner, you’ll find a graph where you can look at trend lines by:
- Users: how many people visited your website in the set time period
- Event count: how many people triggered the events you set up in Google Analytics 4, such as logins or beginning checkout.
- Conversions: the number of people who completed conversion events, such as making a purchase or submitting a lead gen form.
- Total revenue: the sum of revenue generated from your website, including purchases, subscriptions and ads.
You’ll also see the number of users in the last 30 minutes, just like the Realtime report. Scroll down further and GA4 will reveal how these people arrived on your website.
You can choose to break down your new user acquisition using the following criteria.
- First user medium: the medium by which you first acquired the user, such as organic, CPC or referral. This is based on Google Analytics 4’s Cross-channel last-click attribution model, which gives credit to the medium that a user last clicked on before landing on your website.
- First user source: the source by which you first acquired the user based on cross-channel last-click attribution, such as the search engine name (google) or a domain URL.
- First user default channel grouping: the channel by which the user was first acquired, based on Google’s default channel groupings such as Direct, Organic Search, and Display.
- First user source/medium: this will show you both the source and the medium. For example, if you acquired a new user from SEO, the source/medium might be Google / organic.
- First-user source platform: the source platform by which the user was first acquired. In this case, the term ‘platform’ refers to a platform where you manage your media buying, such as Google Ads or Salesforce.
- First user campaign: the campaign by which the user was first acquired, based on cross-channel last-click attribution. This might be a promotional campaign or another marketing campaign that you have run. You can collect campaign data using custom URLs.
There are also options to filter new user acquisition based on:
- Google Ads network type, such as Display, Google Search, and YouTube Videos.
- Google Ads ad group name
- Google Ads ad group ID
On top of New Users, you can filter the Sessions or Engaged Sessions dimension.
Sessions refer to a group of user interactions that take place within a set time period on your website, including page views, clicks, events or transactions. One user can have multiple sessions on your website, because they may navigate away from your page and come back again at a later date.
Engaged sessions are any sessions that last longer than 10 seconds, have a conversion event, or 2 or more screen/page views.
Like New Users, you can filter Sessions and Engaged Sessions based on channels, source, medium, source platform and campaign. You can also filter Google Ads-specific Sessions by ad group, keyword text, and so on:
Lastly, the Acquisition section shows the Lifetime Value trend of your users over the past 120 days:

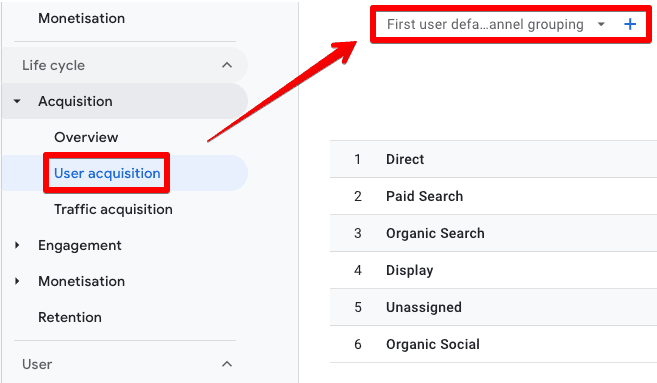
User acquisition: First user medium
Dive deeper into Google Analytics 4’s Acquisition reports, and you’ll find the User acquisition: First user medium report.
This report shows your First user medium, along with trends for your first user medium over time. You can also compare the first user medium for New Users vs. Returning users, and see how each medium performs when it comes to engagement and conversions.
User acquisition: First user default channel grouping
Another area that you can delve into is your first user acquisition data by default channels. This contains the same metrics as the First user medium report, just broken down by Google Analytics’ default channels.
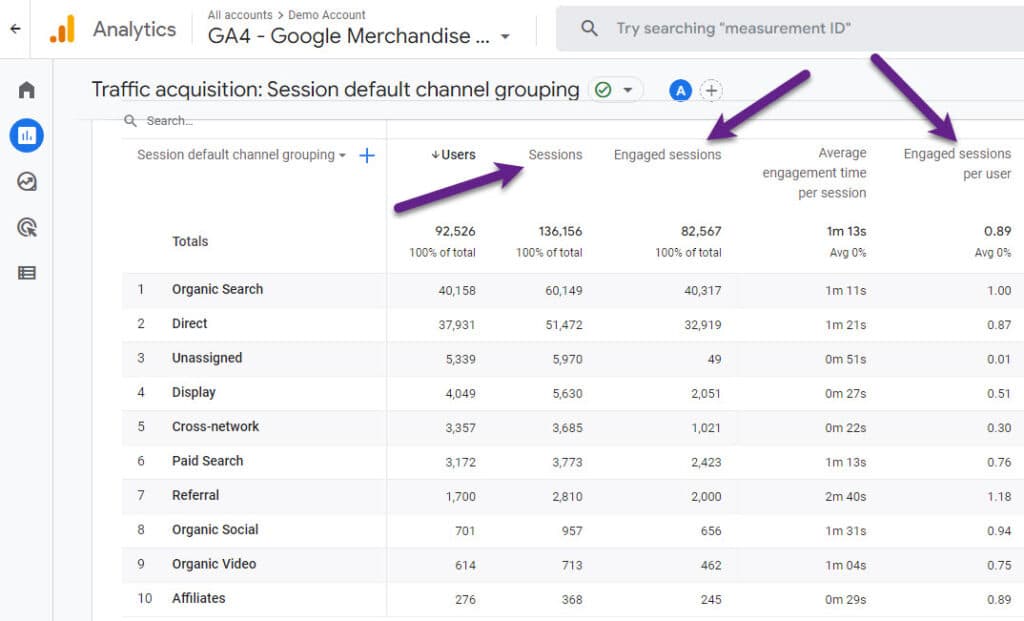
Traffic acquisition: Session default channel grouping
On top of filtering by users, you can use the Acquisition section to filter down your traffic acquisition based on Google Analytics’ default channels.
Insanely detailed, right?
The information in your Acquisition report is an incredibly useful way to measure your SEO and Paid performance. You can break down exactly how much traffic is coming from Organic Search compared to other mediums, and which search engines are driving that traffic.
Engagement Overview
Head further down the funnel, and you’ll find yourself in Google Analytics 4’s Engagement reports. Similar to the Acquisition section, the Engagement section of GA4 has a broad Engagement overview dashboard:
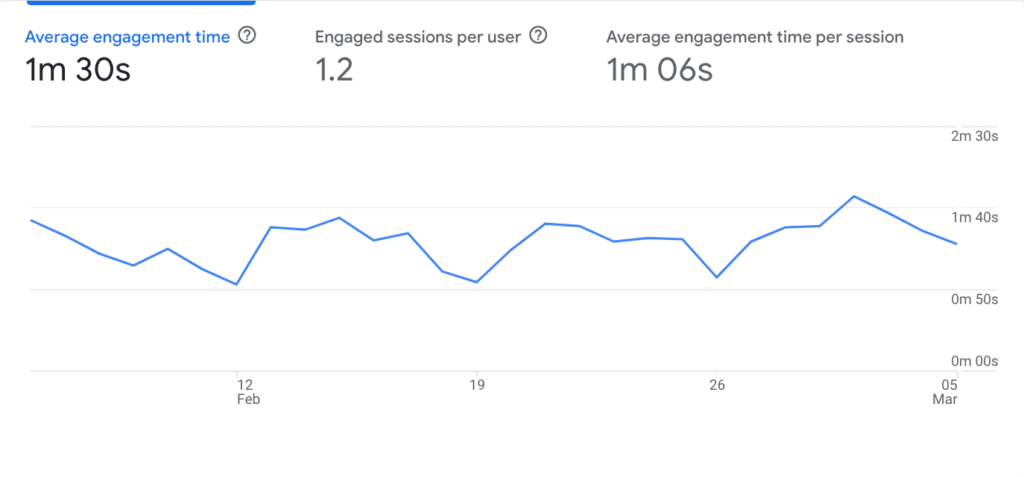
This report looks at key behaviour metrics on your website, including:
- Average engagement time: the average length of time that an active user spends on your page.
- Engaged sessions per user: the average number of engaged sessions that a user has on your website.
- Average engagement time per session.
You’ll also have the number of pageviews on your site, and the total number of events that have taken place. Given that one user can have multiple pageviews and events, it’s normal for these two metrics to be significantly higher than your user count.
There’s a breakdown of the most frequently viewed pages and event counts as well, so you know which pages are most popular and which events occur most frequently (such as viewing a promotion or adding an item to the cart).
At the bottom of the page, you’ll find a chart showing user activity over time for the past day, week and month, and the percentage of user stickiness based on three time frames:
- Daily active users (DAU) / Monthly active users (MAU)
- Daily active users (DAU) / Weekly active users (WAU)
- Weekly active users (WAU) / Monthly active users (MAU)
Events
Within the Engagement section, you can find a report dedicated to events that have occurred on your website. This report shows your event count trends over time based on your top 5 events, along with your event count mapped against your total users.
This information is particularly useful if you’re trying to figure out which actions users complete most often on your website, and which events drive the most revenue. Conversely, you can use it to identify areas of your site that aren’t getting as much love: if you have a “view blog” event but you’re not getting a lot of event counts, it may be worth putting it on a different part of your site to see if you can increase engagement.
Conversions: Event name
The Conversions report provides information specifically on events that you’ve flagged as “conversion events”. The format is the same as the Events report, with the one exception that it also gives you the session source / medium for the conversion event.
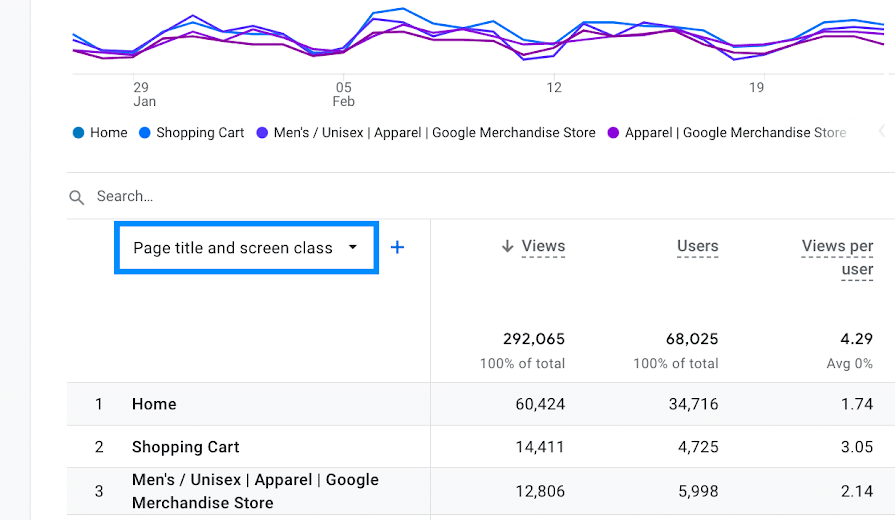
Pages and screens
Your Google Analytics 4 Pages and screens report is where you put the magnifying glass on your most popular site pages. This report breaks down your most viewed pages, before diving into key acquisition, engagement and conversion metrics for each of your site pages in more detail.
Monetization Overview
Not every website sells products or subscriptions, but if you’re running an eCommerce website or you sell advertising space, you’ll find the Monetization Overview particularly helpful.
This eCommerce report breaks down your website revenue by:
- Total revenue
- eCommerce revenue generated from purchases, including tax and shipping
- Ad revenue from advertising space on your site
There’s also an overview of total purchasers and first-time purchases, as well as the average purchase revenue per user on your site. Getting even more granular, you can look at the products, promotions and coupons that have generated the most sales.
Other monetization reports
Google Analytics 4 offers different monetization reports depending on the type of website you have. The eCommerce purchase report summarises your most popular products by item name, and allows you to see the number of views, add-to-carts, and purchases to identify your top sellers:
There’s also an in-app purchases report and publisher ads report for apps or sites that sell advertising space.
Retention Overview
It’s not enough to just bring visitors to your website. The hallmark of any good website is a site that has people returning to it time and time again.
That’s why Google Analytics 4 has a built-in retention overview report. Use this to track your percentage of new vs. returning visitors, and retention and engagement trends over time.
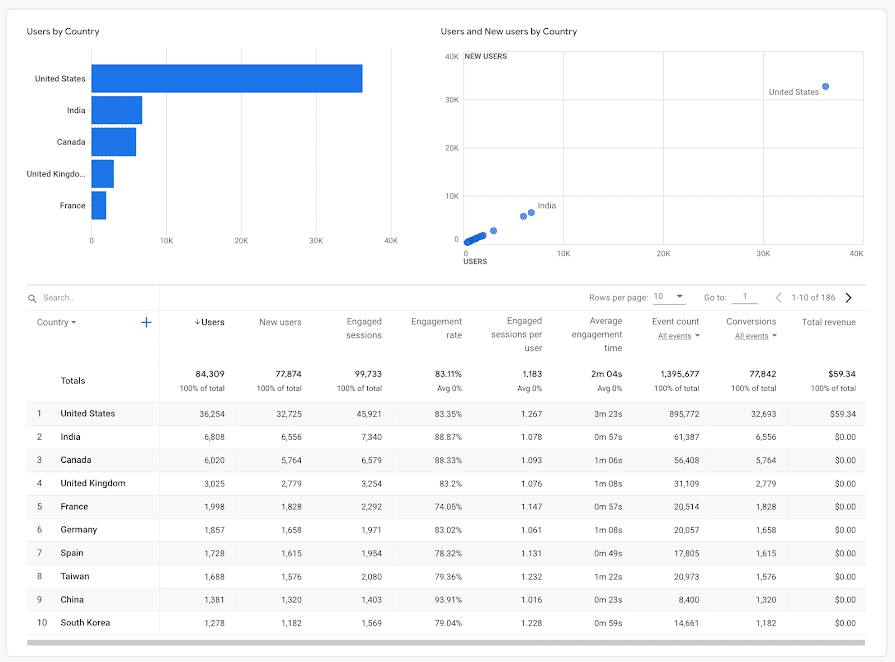
Demographics reports
GA4 has kept the bulk of the Google Analytics Audience report from Universal Analytics, although the information is presented in a more high-level format to accommodate for any data tracking and cookie updates in the future.
The Demographics Overview report gives a rundown of your users’ location by country and city, alongside their interests age, and browser language.
There’s also a Demographic Details report which breaks down key acquisition, engagement and monetization metrics by country:
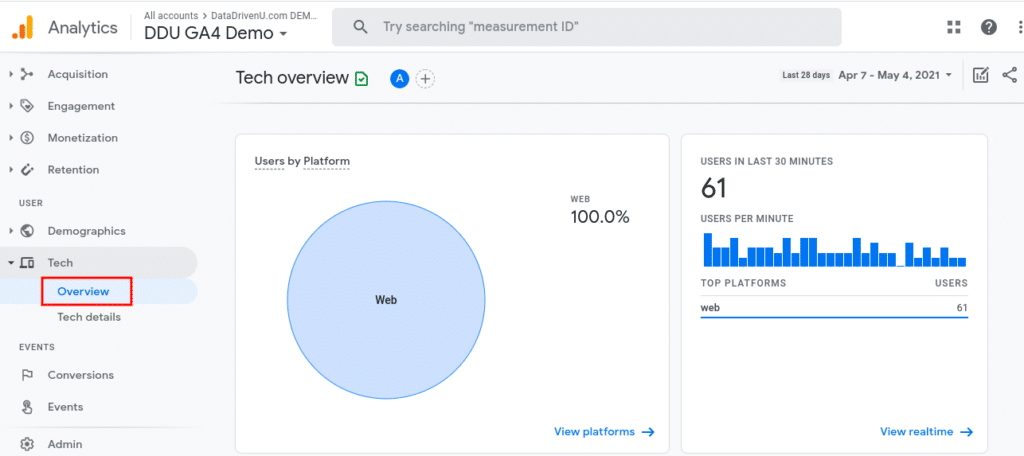
Tech reports
Last but not least, Google Analytics 4 has tech reports that help site owners best optimise the experience based on which devices people are using.
The Tech Overview reveals how users are accessing your website, broken down by browser, device, operating system and screen resolution:
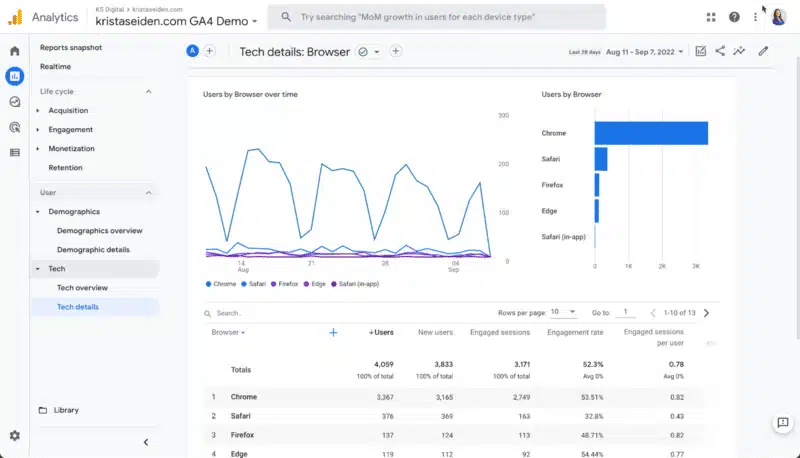
You can delve further into this Google Analytics data in the Tech Details report, which looks at key life cycle metrics for different browsers:
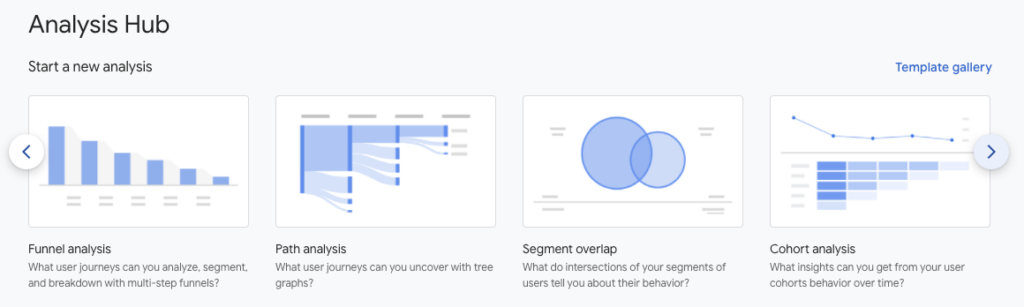
Explore the Analysis Hub
Google Analytics 4 has a lot of built-in reports ready and waiting to go. But arguably one of the most powerful new features is its new Analysis Hub.
GA4 Explorations allow you to gather insights using a variety of advanced techniques and templates — giving you even more flexibility to unearth data that matters to your digital marketing campaigns.
To get started, navigate to “Explore” in the left-hand menu.
You’ll be presented with different Exploration templates and previous templates that other users have built already:
From here, pick how you want to visualise your data based on Google’s existing templates.
Free-form
Build custom charts and tables that display the data you need at a glance. For example, you might choose to map out events for visitors living in Adelaide, or map acquisition metrics for mobile users only.
Funnel exploration
This template breaks down user journeys into multi-step funnels. You can see the steps that users take before reaching a certain event, or how users from different channels behave on your site.
Path exploration
Path explorations are similar to Behavior journeys in Universal Analytics. This tree graph shows the different paths that users navigate through, and the events that they trigger along the way.
This type of template is handy for pinpointing and plugging leaks in your customer funnel where users are likely to drop off.
Segment overlap
Segment overlap reports show any overlap between two groups, such as users who visit the website on mobile vs. users who visit on desktop, or users from a specific city mapped against users who arrived at your website from a specific channel.
Cohort analysis
Cohort analysis is a way to look at the behaviour of a certain group of users, such as all visitors who added an item to their cart or all users who arrived on your website on a certain date. This is useful as a way to map conversions in relation to specific marketing tactics.
User Lifetime
User Lifetime analysis is helpful because you can use it to figure out which channels or marketing actions are driving users with the highest lifetime value. For example, you might find that while you’re getting a lot of revenue from email, your organic search visitors have the highest lifetime value. Over time, this information can be used to adjust marketing investments to improve ROI.
Unlock Your Marketing Potential with GA4
When it comes to taking your digital marketing to the next level, Google Analytics 4 is an absolute game-changer. With its advanced features and capabilities, GA4 can help you gain a deeper understanding of your audience, optimise your website’s performance, and skyrocket your business growth.
But let’s face it, not everyone has the time or expertise to master GA4 on their own.
That’s where our team at Reef Digital Agency comes in. We’re a group of digital marketing experts who specialise in GA4 set-up, training, and optimisation, and we’re here to help you achieve your goals.
We know the importance of delivering results for our clients, and we’re confident we can do the same for you. Whether you’re looking for help setting up your GA4 account, analysing your data, or making data-driven decisions to take your business to the next level, we’ve got you covered.
So, what are you waiting for? Get in touch with us today for a free consultation and learn more about how we can help you make the most out of Google Analytics 4. We’ll work with you to develop a customised proposal that fits your specific needs and budget, and provide you with exceptional customer service and support every step of the way.