
Every agency specialist or in-house marketer will have been asked the question “What is a good click through rate (CTR) for a website?” at least once in their career. The answer, of course, is that there is no hard-and-fast answer, as CTR varies by industry, by country, by competitive landscape, as well as a host of other factors.
Even though a universally accepted “good CTR” will never exist, the desire for business owners or CEOs to ask the question is understandable. Position in the market is one of the most important things for a business to track, and CTR (for organic and paid search) initially seems to be a simple way to judge online marketing performance relative to the competition.
Over the last couple of years, Google and Bing have recognised the value of testing performance against similar competitors both from paid search and on-site engagement perspectives. There are now a number of tools that can be used to compare your company or client’s performance against their peers. Even CTR can now be compared to an average figure (in certain circumstances)!
This blog will run through some of the most helpful tools available for measuring the performance of an online marketing strategy against a relevant, not universal, benchmark.
Relative CTR
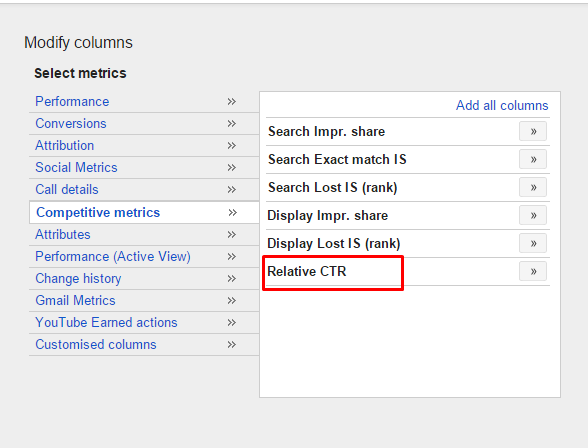
The relative CTR allows to give you an idea of the performances of your ads compared to your competitors in the same places on the Google Display Network. This is useful for measuring the performance of display ad creative under the same variables (user, site placement, buying intent, etc) as your competitors. Unfortunately this feature does not exist for the search network, most likely due to the complexity of comparing ads in different positions on the search result page (which naturally have different CTRs). The metric is expressed as a decimal relative to 1, the higher the number the greater the performance relative to the average, e.g. 3x would mean your ad has a CTR 3 times higher than the average for advertisers on the sites and ad positions your targeting is eligible for.
The Relative CTR report can be added in the columns data section as follows:
Google Analytics Benchmarking
Google’s documentation defines the Benchmarking report in Analytics as follows:
Benchmarking allows you to compare your data with aggregated industry data from other companies who share their data. This provides valuable context, helping you to set meaningful targets, gain insight into trends occurring across your industry, and find out how you are doing compared to your competition.
Benchmarking has to opted into in the account settings, as to take part you also need to share data from your Google Analytics profile, however the data that this gives you access to makes this small consideration more than worthwhile. It is worth noting that no commercially sensitive data such as revenue or user information will be shared under the opt-in, and any data that is shared will not be identifiable to your business.
To access the Benchmarking reports, navigate to the view you wish to see data for, select the Reporting tab, then go to Audience > Benchmarking. Three reports are then available to choose from:
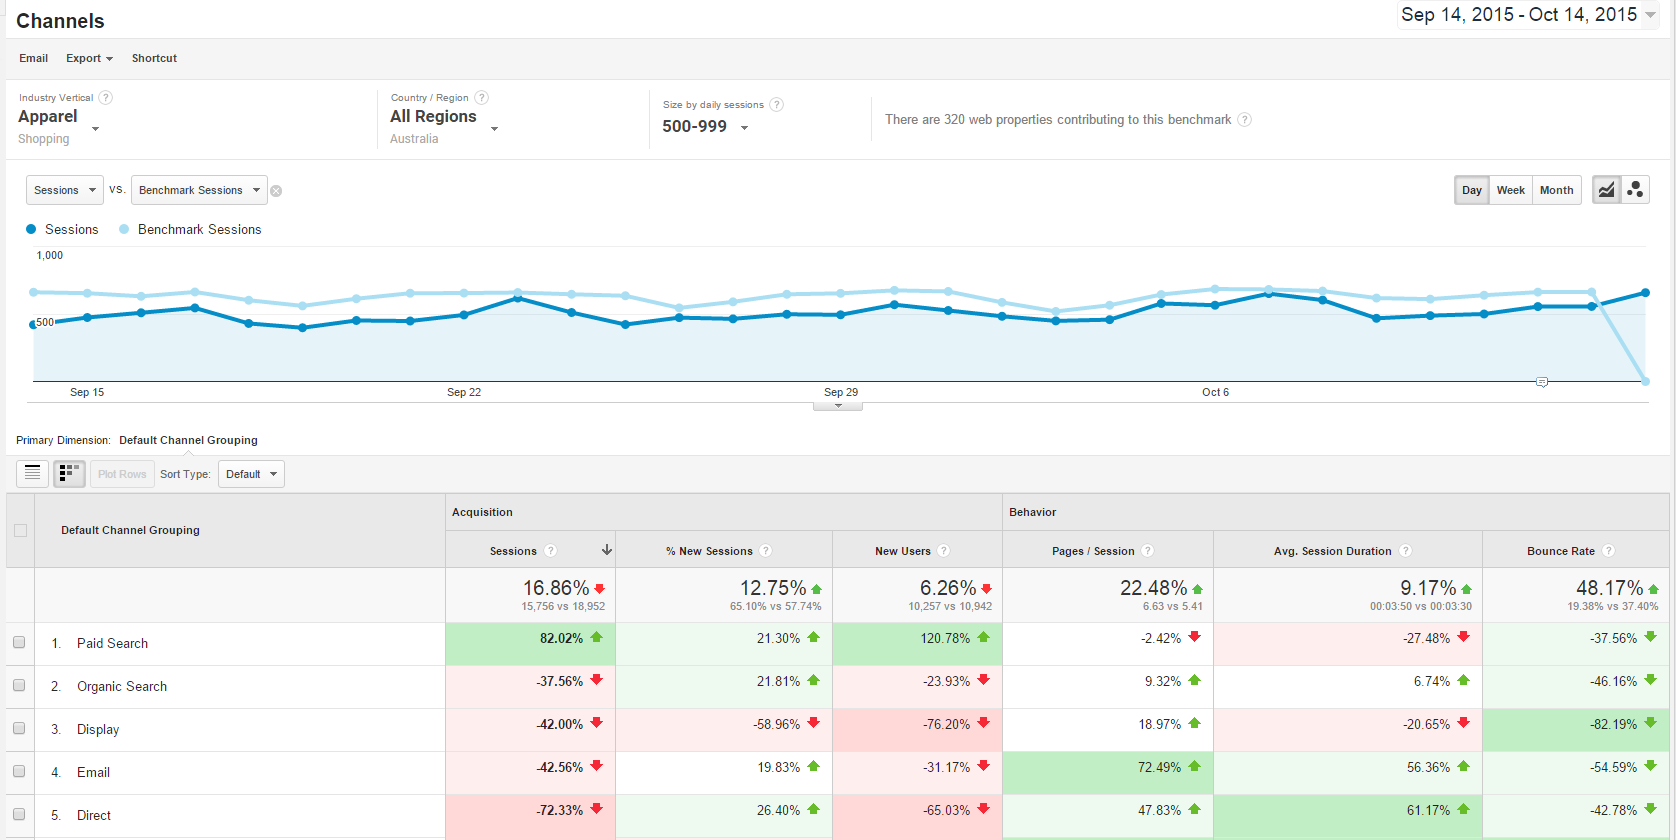
Channels (pictured) compares your channel data to the benchmarks for each channel in the Default Channel Grouping: Social, Direct, Referral, Organic Search, Paid Search, Display, Email.
Location compares your Country/Territory data to the benchmarks for each of the Countries/Territories from which you receive traffic.
Devices compares your Devices data to the benchmarks for desktop, mobile, and tablet traffic.
The benchmark data can be drilled down by company size (in terms of sessions per day), industry vertical and geographic location, with the ability to use all three filters simultaneously to really narrow down the data set to reflect your true competitors.
The values in the table show the percentage by which your property outperforms or underperforms the benchmark for each metric. A positive value (for example, 67.80%) indicates that your property outperforms the benchmark. A negative value (for example, -25.25%) indicates that your property underperforms the benchmark.
Auction Insights Report
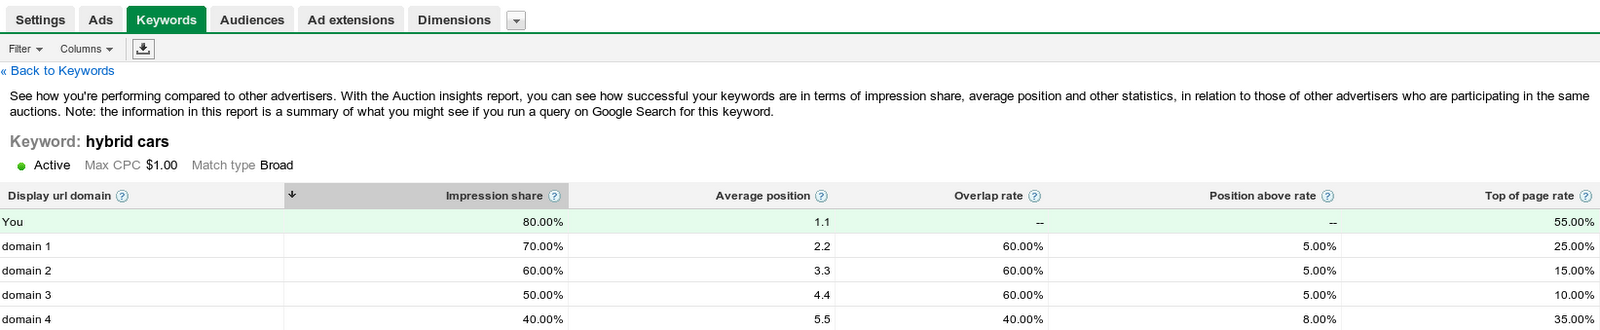
Search Engine Land have written an excellent guide about how to get the most value out of this feature, the introduction to the report sets out the useful data points the report can offer:
- Impression share – the percentage of impressions you received compared to the total impressions you were eligible for.
- Ad position – the average rank of your ad on the page.
- Position above rate – how often participants were shown in an ad position above you.
- Overlap rate– how often other advertisers appeared in the same auction as you.
- Top-of-page percent – the proportion of time your ad appeared at the top of the page, above the search results.
These metrics are based on a sample of impressions within your selected date range. The data provided is based on others who matched for the same search query. They do not need the same keyword, match type, or settings.
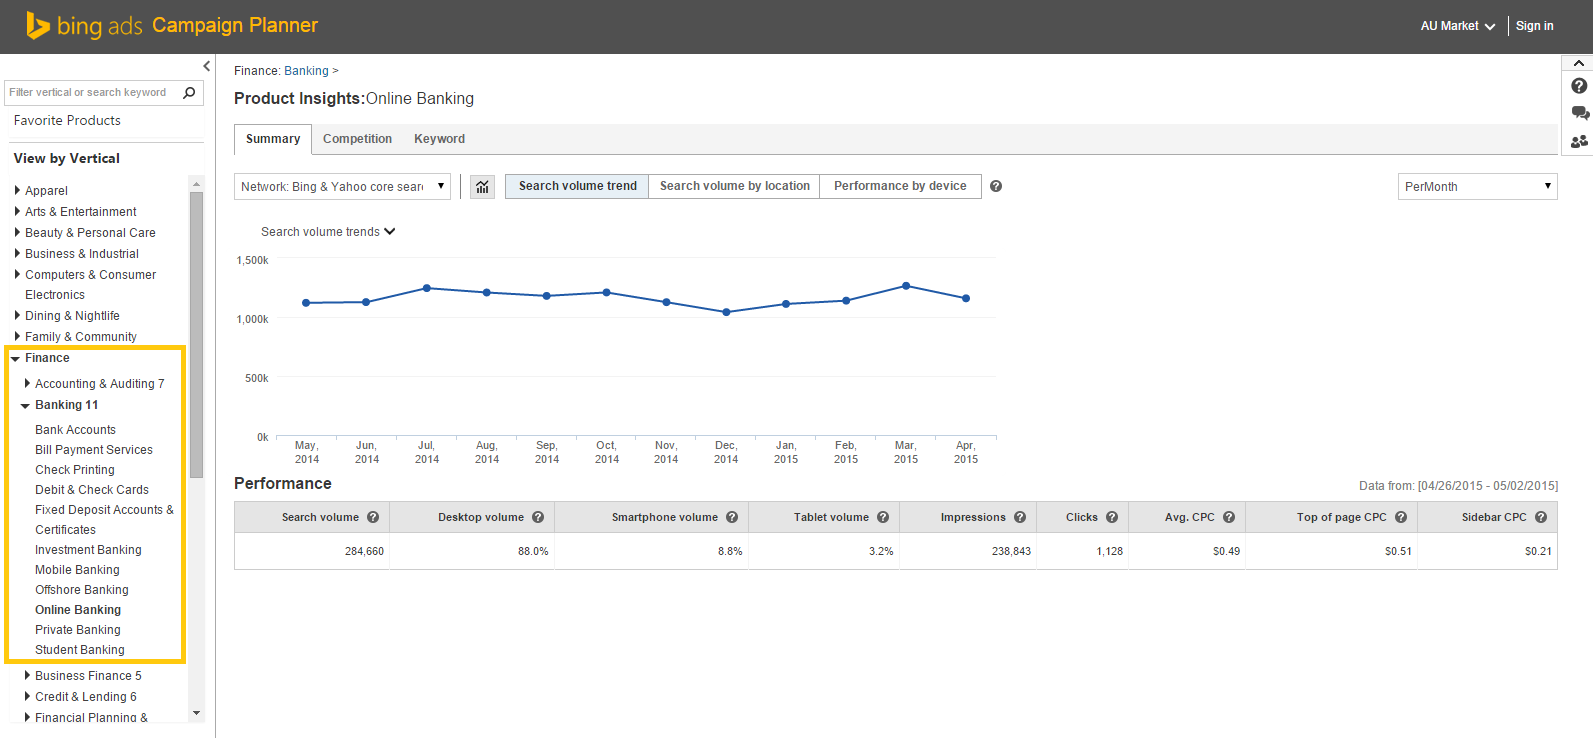
Bing Campaign Planner Tools
I recently wrote a guide to the Bing Campaign Planner on the Reef blog, which shows how the tool can be a powerful source of competition data for a whole range of industries
The main points in the guide relating to competitor insight are as follows:
Market Place Insights
Using the panel on the left hand side, you can select a vertical (e.g. Finance) to find relevant metrics such as search volume, average CPCs and device performance for that vertical. You can then select a sub vertical (e.g. Banking) to find more specific insights. To dive even deeper, you can then choose a product from that vertical to get product-specific insights (e.g. Online Banking).
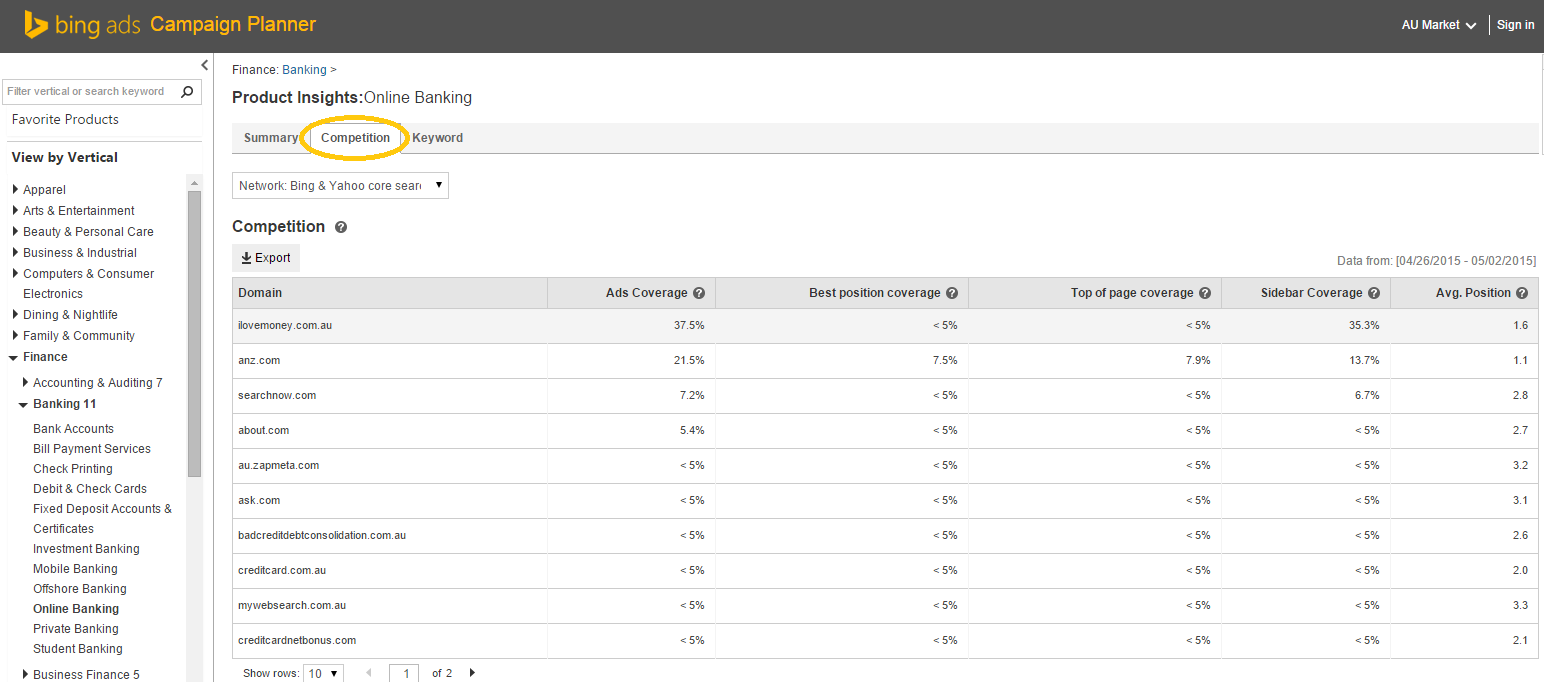
Competitor Insights
You can have a look at who your competitors are and what they are doing by selecting the “Competition” tab. This will show you Ad Coverage and Average Position for your top 10 competitors. This data can be exported to an excel file for further analysis.
So, that’s it for this blog post looking at ways to measure performance against relevant competitors, but if you have any questions please reach out to the Reef PPC team or let me know in the comments section below.